Score and Rounds Completed Report
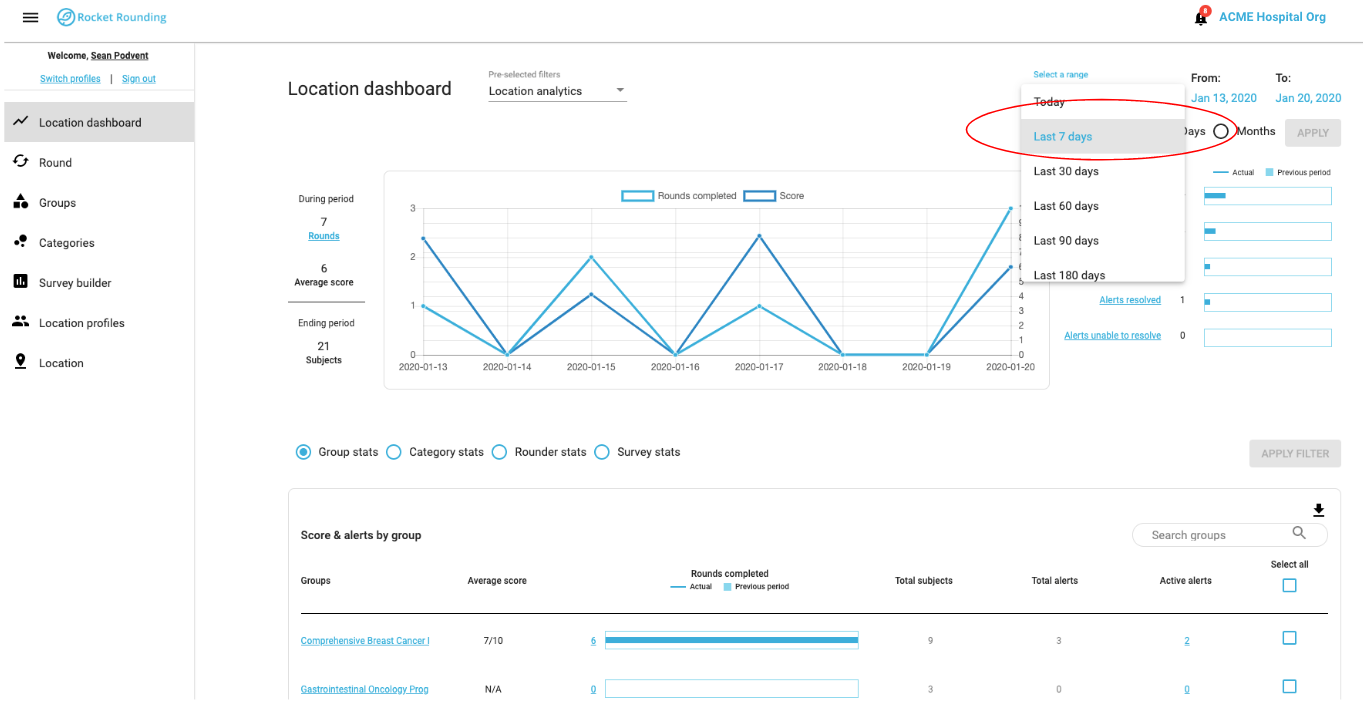
A user with the correct permissions can see scores and rounds completed for a location and create reports over specified periods of time. Below is an example from the web application.
Click “Location dashboard” on the side navigation and the dashboard will appear with the location’s analytics including score and number of rounds completed over a period of time
2. If you are a Location Admin, select the type of dashboard analytics you would like to see by clicking the “pre-selected filters” dropdown next to the words “Location dashboard” in the upper left corner. You can choose between “Location analytics” (default), or “My group analytics” if you are assigned to groups, or “My categories” analytics if you are assigned to categories. Note that each of these selections will filter the entire dashboard
3. Select a date range (the dashboard defaults to 7-days) in the upper right corner if you want to customize the time period you are trying to report on
4. On the left side of the screen you will see the number of rounds completed and the average score below it. If you want to view each round, you can click on the hyperlink below the number of rounds completed and you will be taken to a listview with the rounds
5. To view a trend-line chart that contains the score and the number of rounds completed over the time, there is a chart in the middle of the screen. The number of rounds completed is displayed in light blue, and the score is displayed in dark blue. The y-axis on the left side of the chart is a variable number that represents the number of rounds completed and the y-axis on the right side of the chart is a fixed number (1-10) that represents the score
6. To download the above data and view it in Microsoft Excel, Google Sheets, or Apple Numbers click the download icon near the upper right corner of the trend-line chart. A .cvs file will download, which can be opened in one of the aforementioned programs


